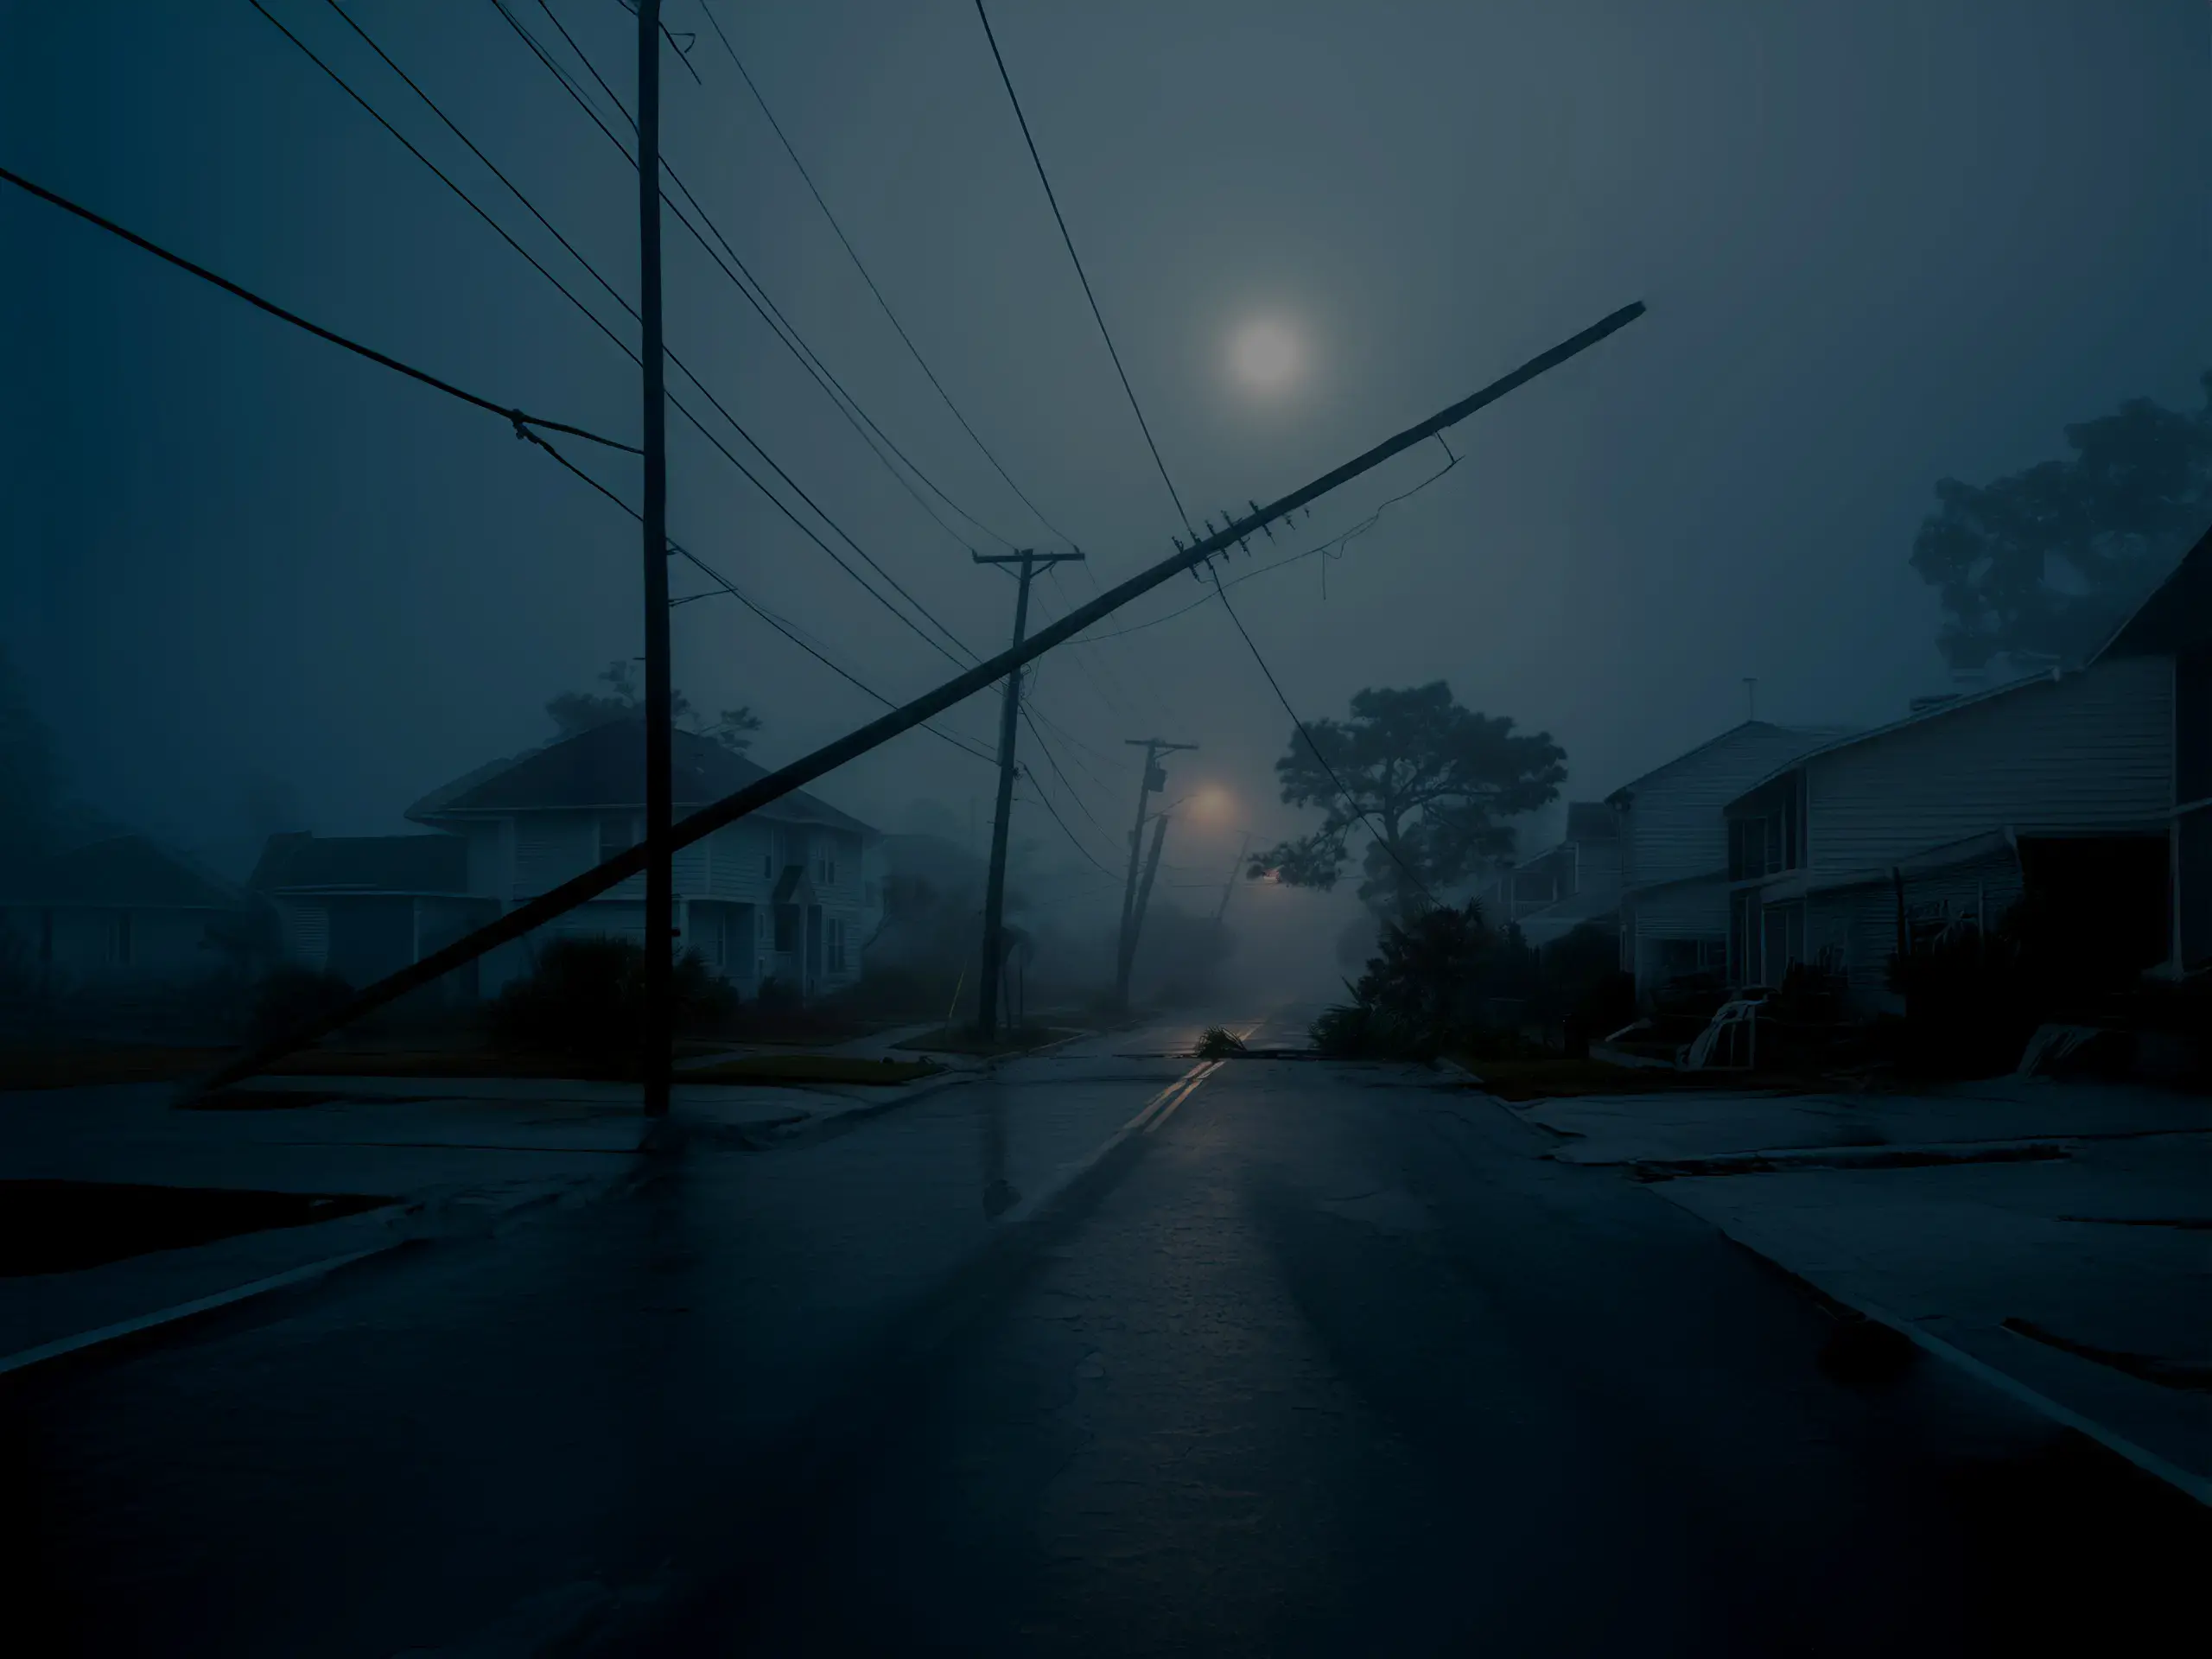
Storm Response and Vegetation
Encroachment Reporting
AI-powered reports delivering real-time insights and predictive analytics to improve storm and vegetation encroachment response.
Better Storm Response
Before, during and post storm insights for better preparation and faster recovery.
Vegetation Management
Early warnings on vegetation threats to protect critical feeders and prevent outages.
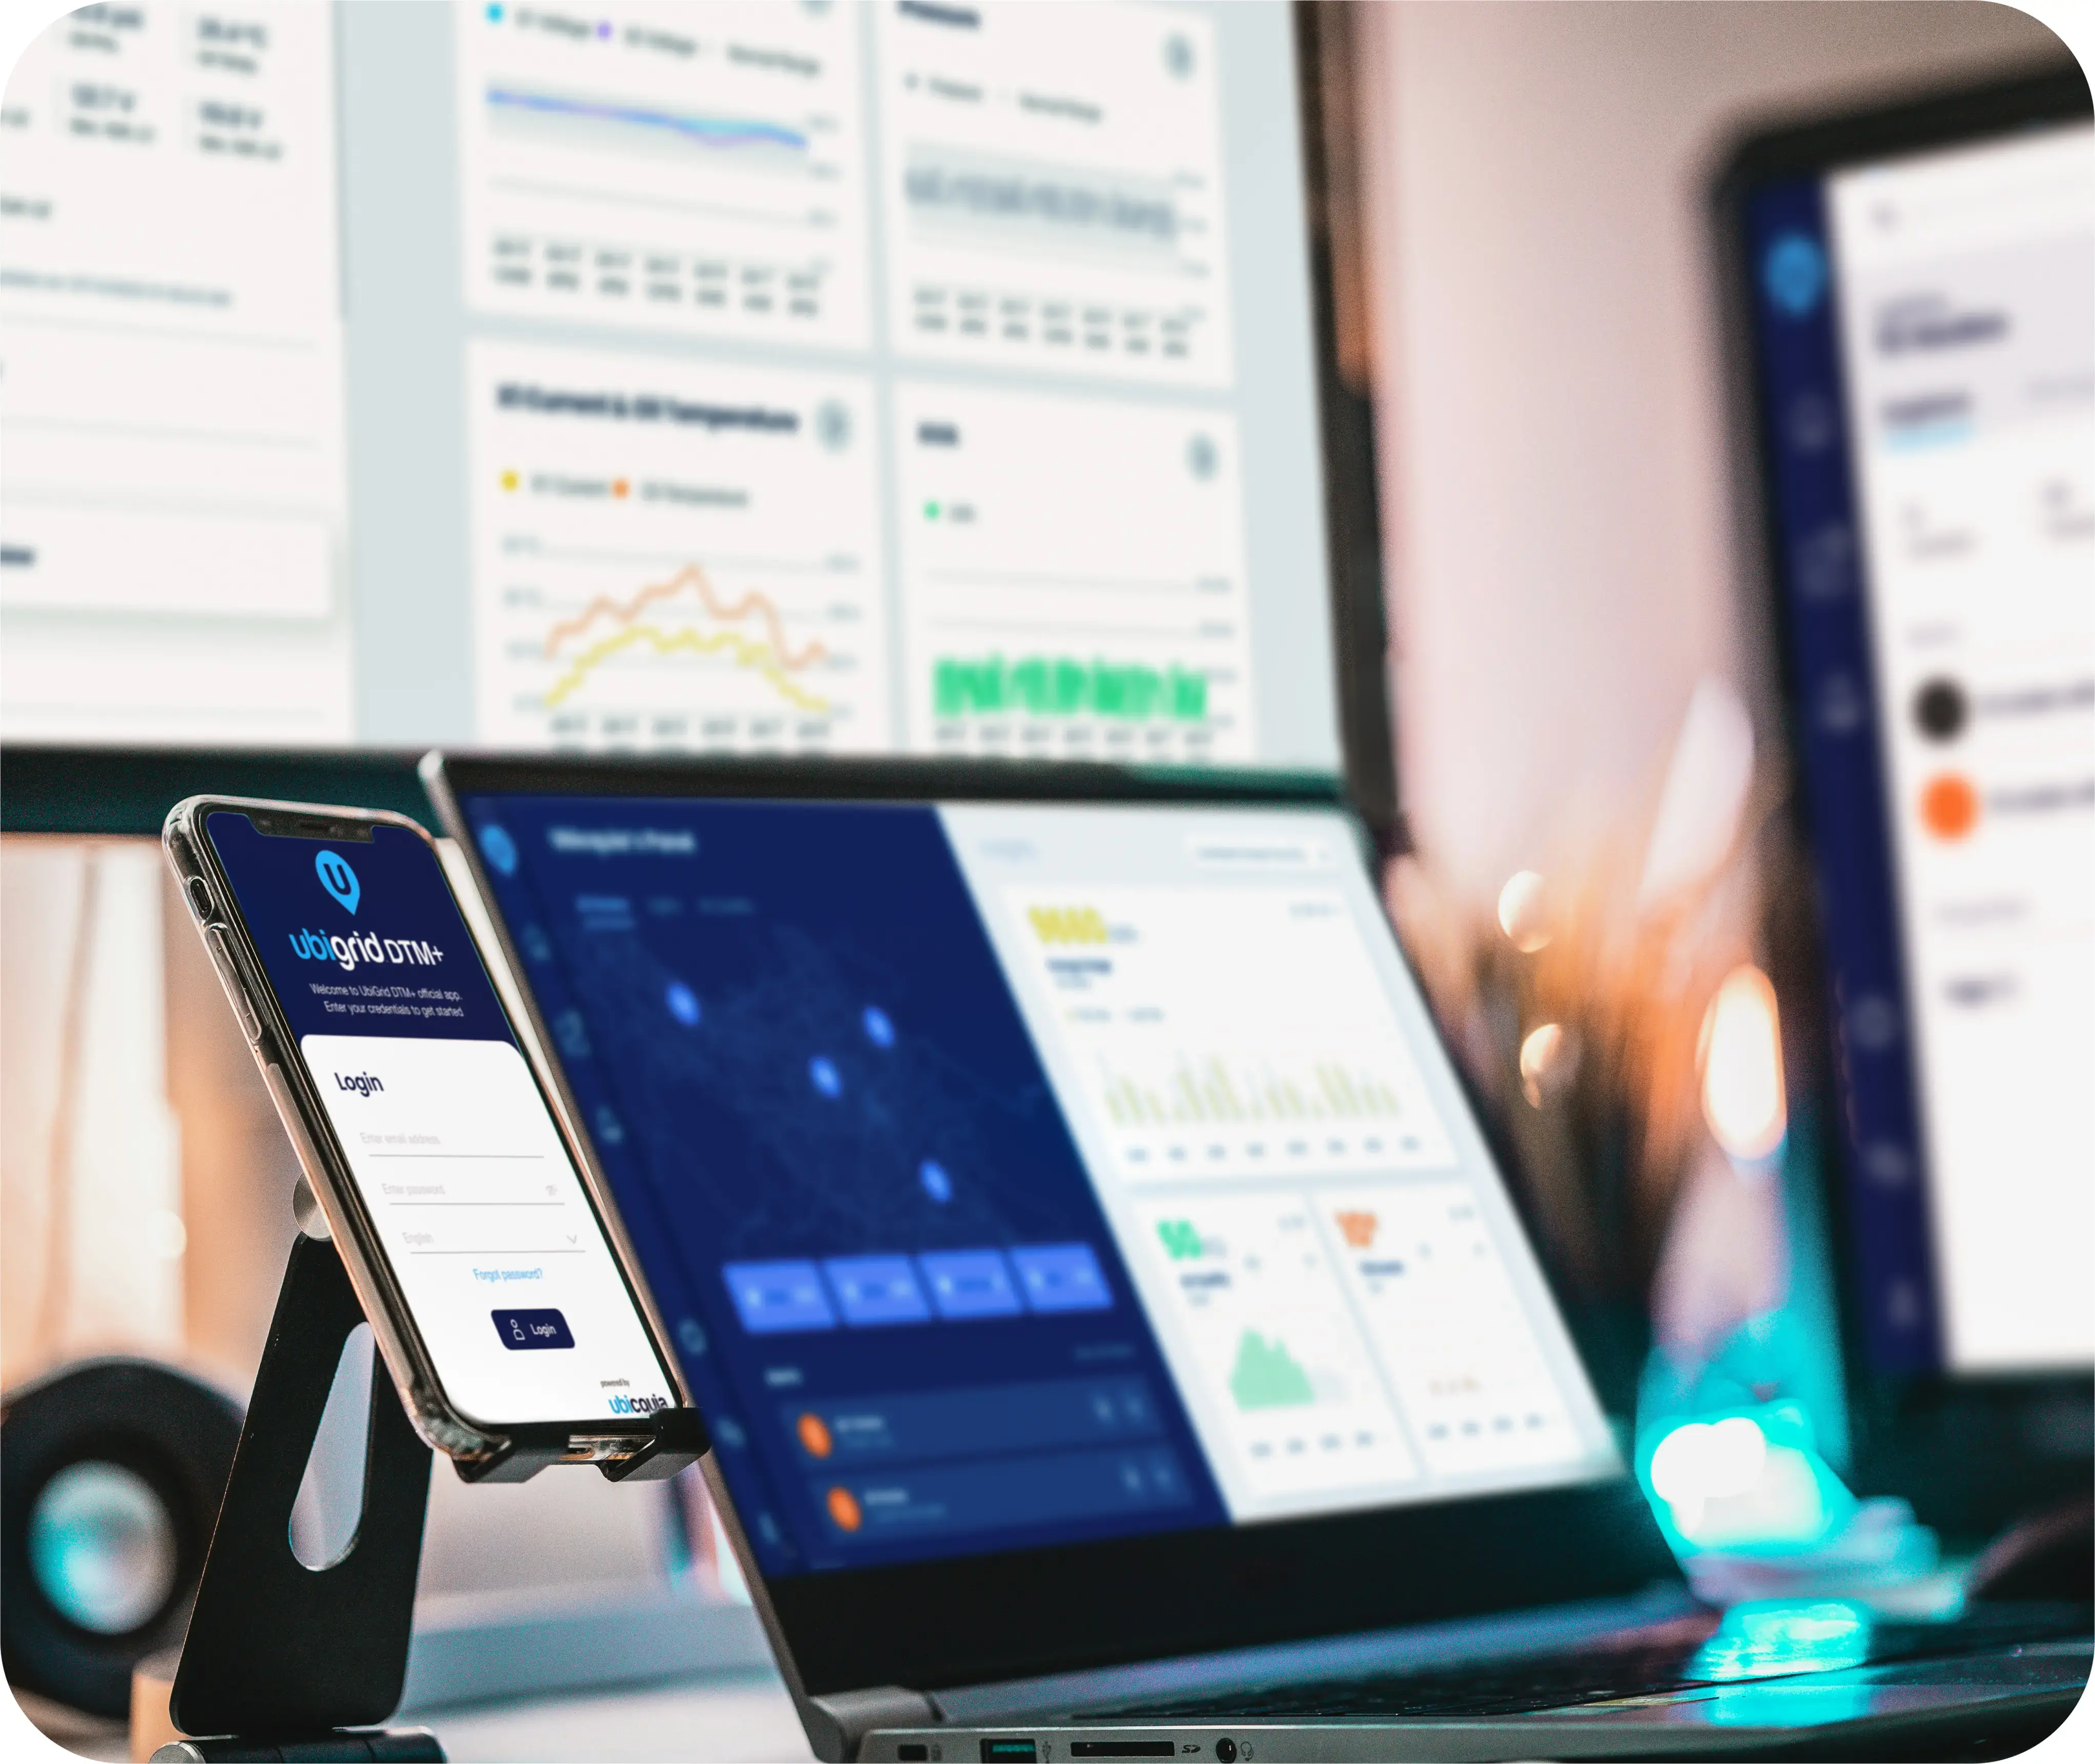
Integration with APIs
Integrates with utility management systems to provide insights with precise GIS data.
The reports are generated using real-time data from Ubicquia’s intelligent streetlight and transformer sensors. Analyzed by patented UbiVu AI models, these reports deliver insights to avoid outages and prioritize recovery actions. Developed through extensive real-world testing, the reports are continuously refined in collaboration with experts in storm response and asset management.
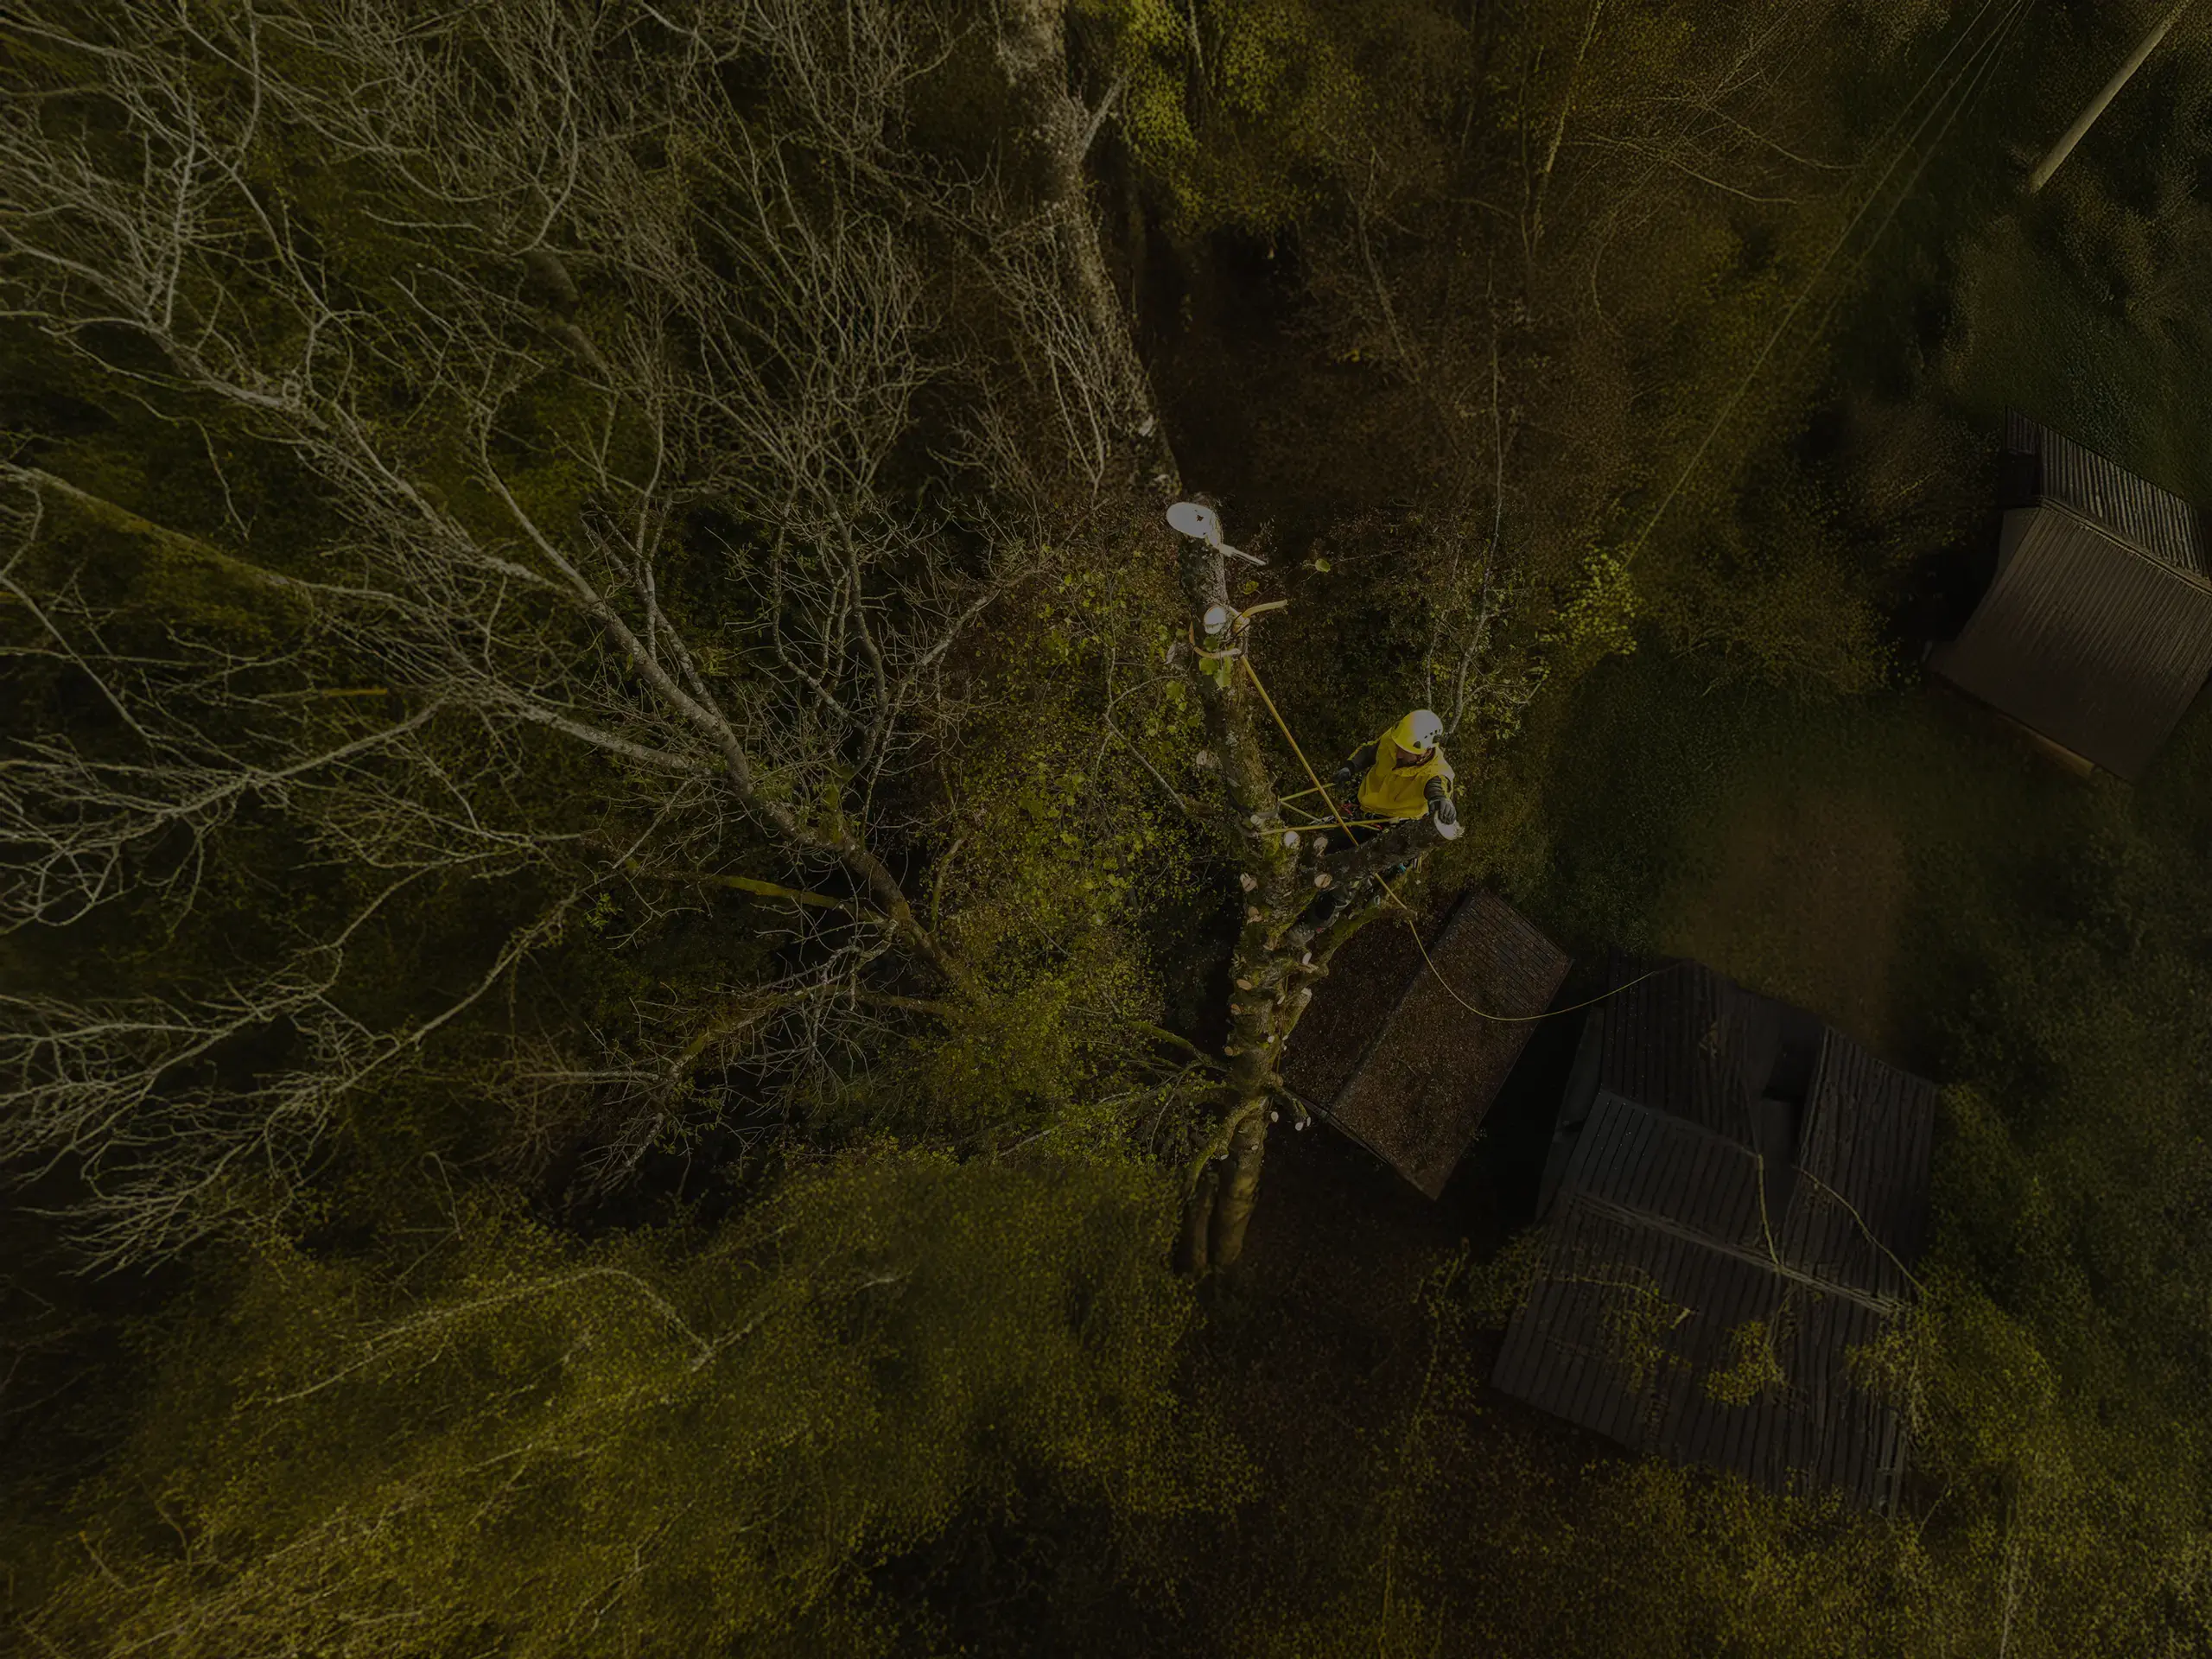
Vegetation Management:
A Multi-Billion Dollar
Issue for Utilities
Utilities grapple with rising costs as vegetation threatens power lines and poses safety risks. This challenge is exacerbated by faster vegetation growth, severe weather, and aging infrastructure. Traditional cyclical trimming methods are inefficient and costly. Using insights from Vegetation Encroachment reports, utilities can adopt proactive maintenance strategies to enhance safety, reduce costs, and ensure more reliable services.
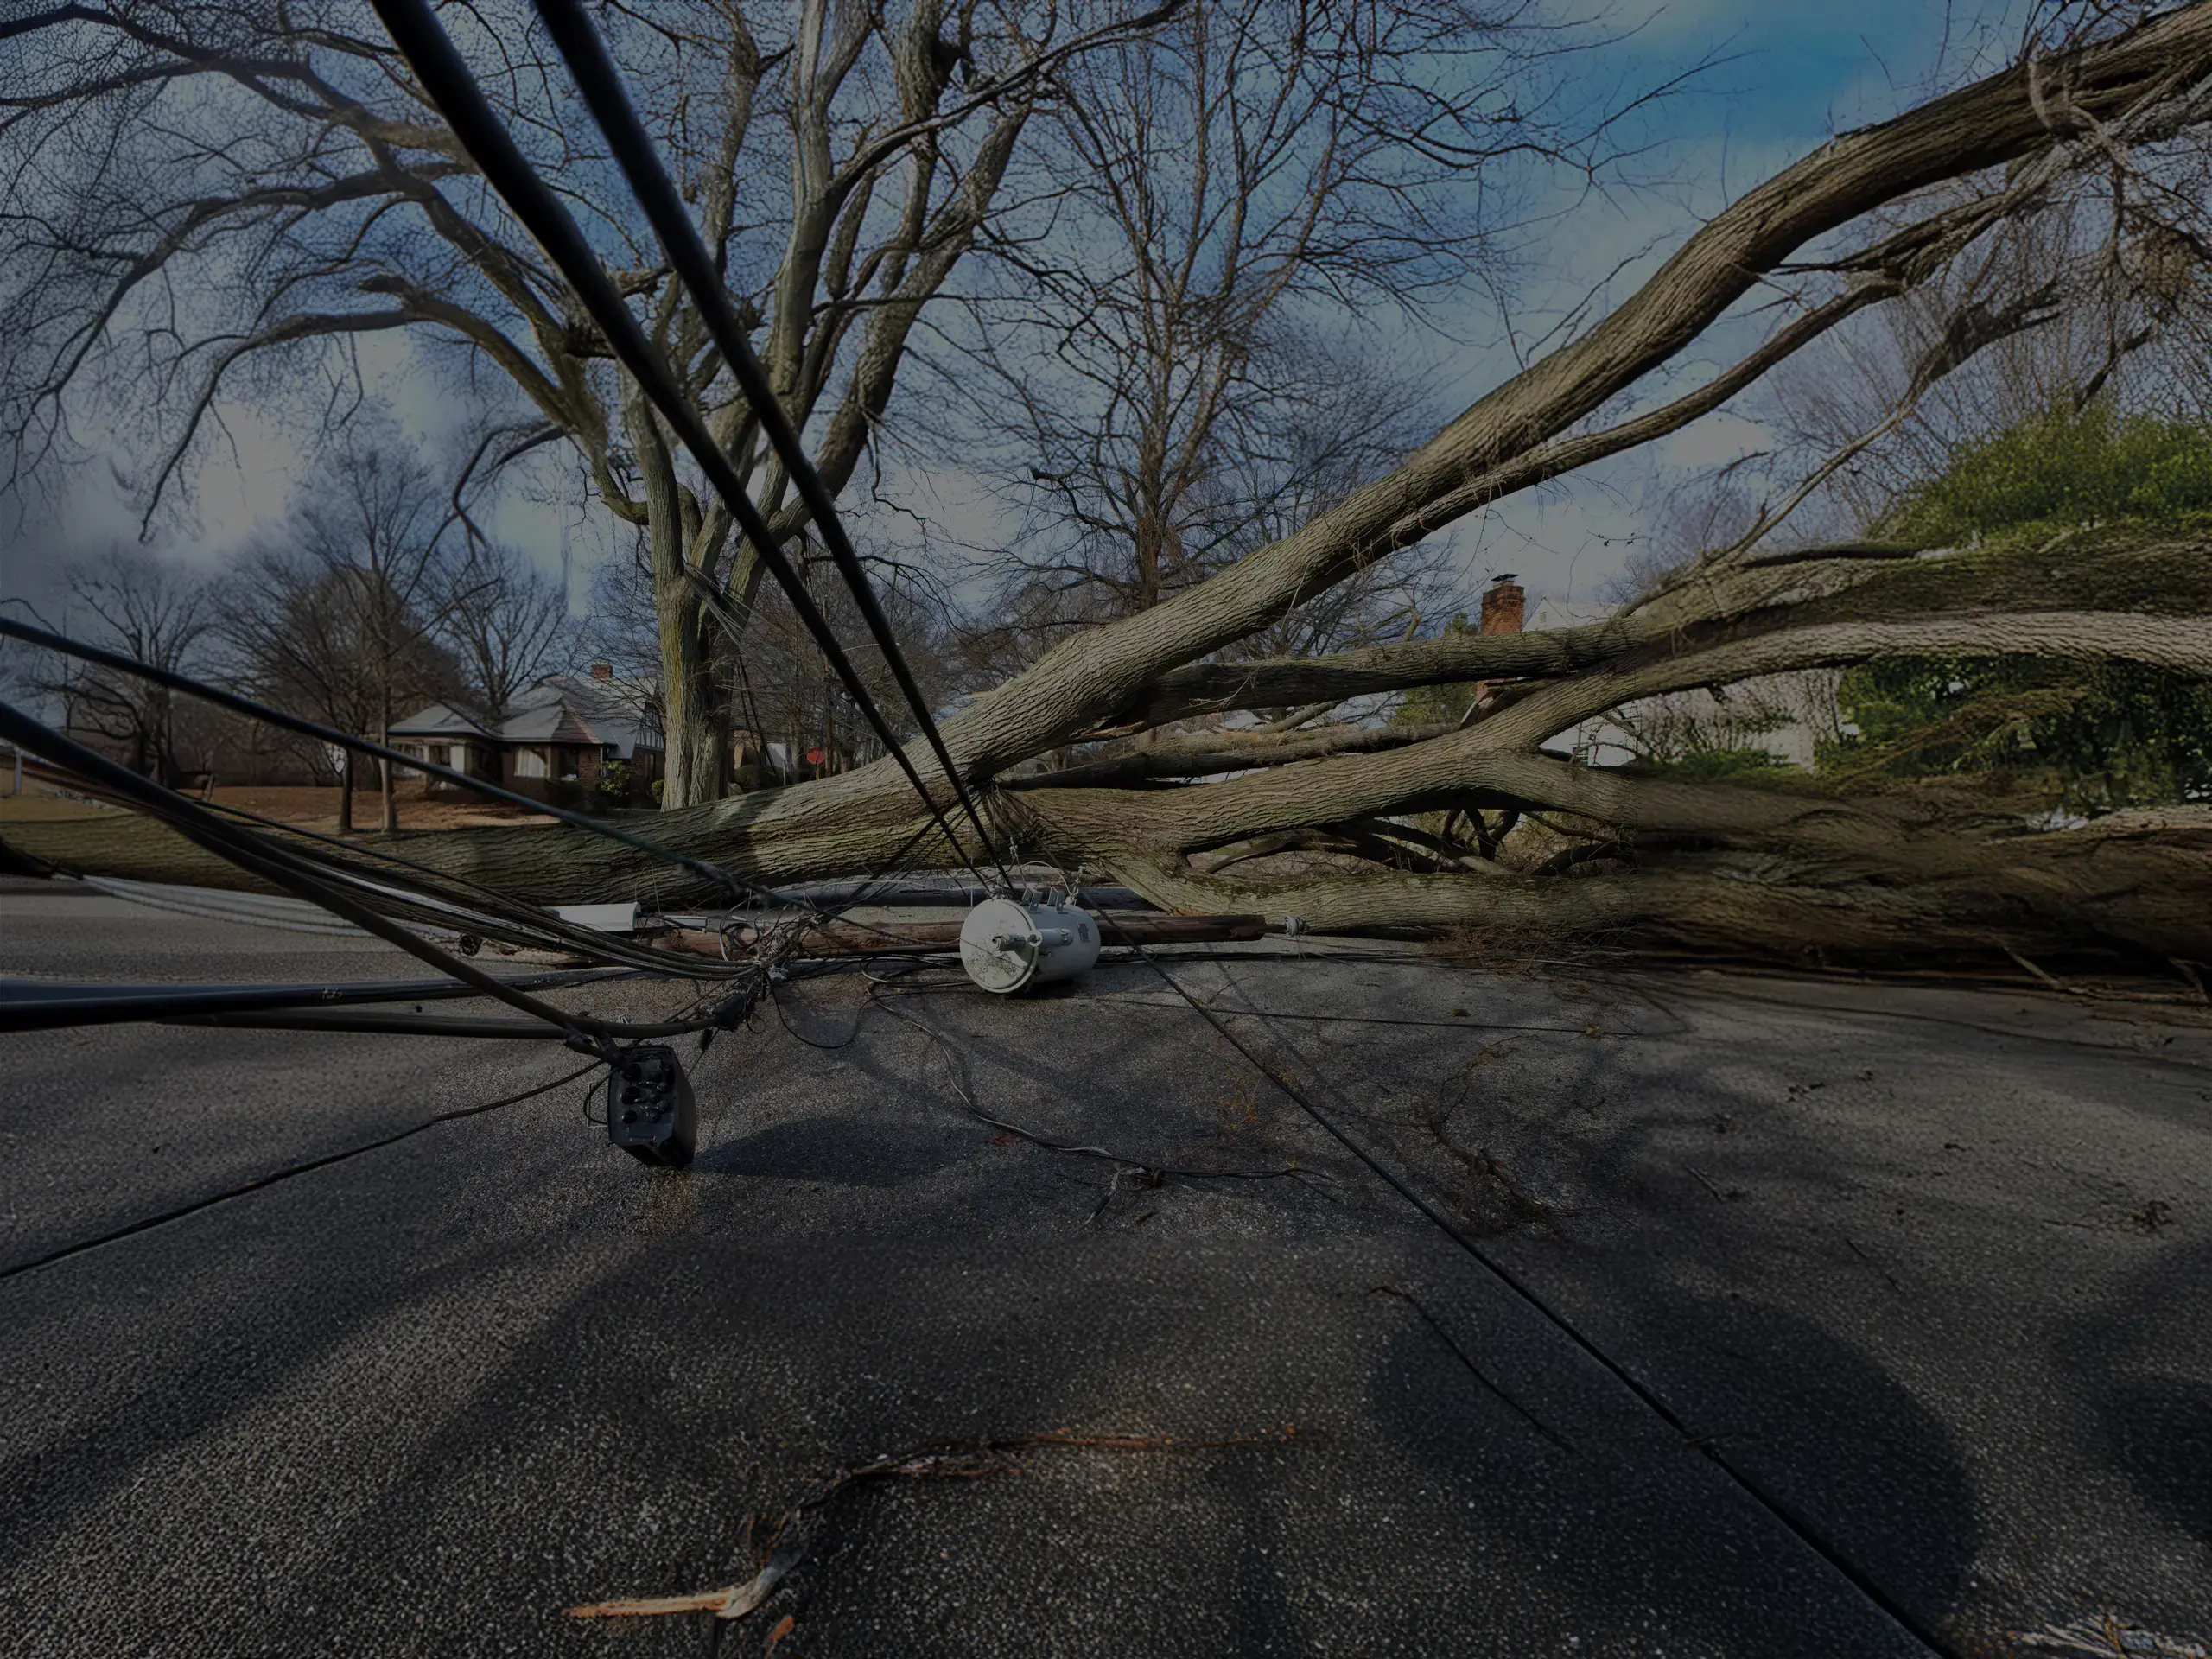

What an expert in storm response says about our Storm Response and Vegetation Encroachment Reporting
"Limited visibility during outages impedes effective storm response. Ubicquia changes the game by providing comprehensive in-storm visibiity and root cause analysis, enabling faster, more efficient responses. This technology helps prioritize efforts, making crew more effective and restoring power to customers quicker."
- MANNY MIRANDA
- President of Next Level Energy Services.
Storm reports are compiled by Ubicquia's data science and analytics team exclusively using data from the company's advanced analytics platform, UbiVu. They are available in real-time during a storm to maintain visibility on power outages and impacted poles.
The reports are in PDF format and available upon request.
The storm reports show power outages and damaged transformers, streetlights, and poles. When this information is available, power outages are shown as a percentage of devices installed per county, substation, and feeder so that a utility can stage assets for clean-up with as much precision as possible. The same visibility is offered for downed and/or leaning poles, except pole-level detail is also provided, as these are priority clean-up cases.
The DTM+ monitors power quality events like voltage sags and swells in real-time. Consistent increases in the count and severity of these events in specific segments of the power grid during high wind and precipitation can indicate vegetation encroachment on the uninsulated primary line. Taking a long-term view of the power quality events, these correlations with weather patterns strongly indicate a vegetation problem.
Reports can be generated on a schedule supporting officials' operations in the storm-affected region. Some want a report right after the all-clear and daily reports while clean-up is underway. Others will wish hourly updates during the days leading up to the storm and over its course. Reports can be delivered on a cadence ranging from hourly to daily.
